![]()
![]()
This project includes a model, an importer, and some visualizations to evaluate the health of a GitLab or GitHub group.
Download a Moose image.
In the Moose image, in a playground (Ctrl+O, Ctrl+W), perform:
Metacello new
    repository: 'github://moosetechnology/GitProjectHealth:main/src';
    baseline: 'GitLabHealth';
    onConflict: [ :ex | ex useLoaded ];
    onUpgrade: [ :ex | ex useIncoming ];
    onDowngrade: [ :ex | ex useLoaded ];
loadIn a playground (Ctrl+O, Ctrl+W):
glhModel := GLHModel new.

repoApi := GitlabApi new
    privateToken: '<my private token>';
    hostUrl: 'https://gitlab.myPrivateHost.com/api/v4'.

gitlabImporter := GitlabModelImporter new
    repoApi: repoApi;
    glhModel: glhModel.

"137 is the ID of the a Group, you can find the number in the webpage of every project and group"
gitlabImporter importGroup: 137.In a playground (Ctrl+O, Ctrl+W).
glhModel := GLHModel new.

githubImporter := GithubModelImporter new
    privateToken: '<my private token>';
    glhModel: glhModel.

githubImporter importGroup: 'moosetechnology'.Note
GitLab API only.
You might want to gather more commits for a specific repository. To do so for GitLab, we added the following API:
myProject := (glhModel allWithType: GLHProject) detect: [ :project | project name = '<my project name>' ].

gitlabImporter importCommitsOfProject: myProject since: nil until: '2023-01-01'.To visualize the group "health":
myGroup := (glhModel allWithType: GLHGroup) detect: [ :group | group id = 137 ].
canvas := GLHGroupVisualization new forGroup: { myGroup }.
canvas open.To export the visualization as an svg image:
canvas svgExporter
    withoutFixedShapes;
    fileName: 'drit-group-health';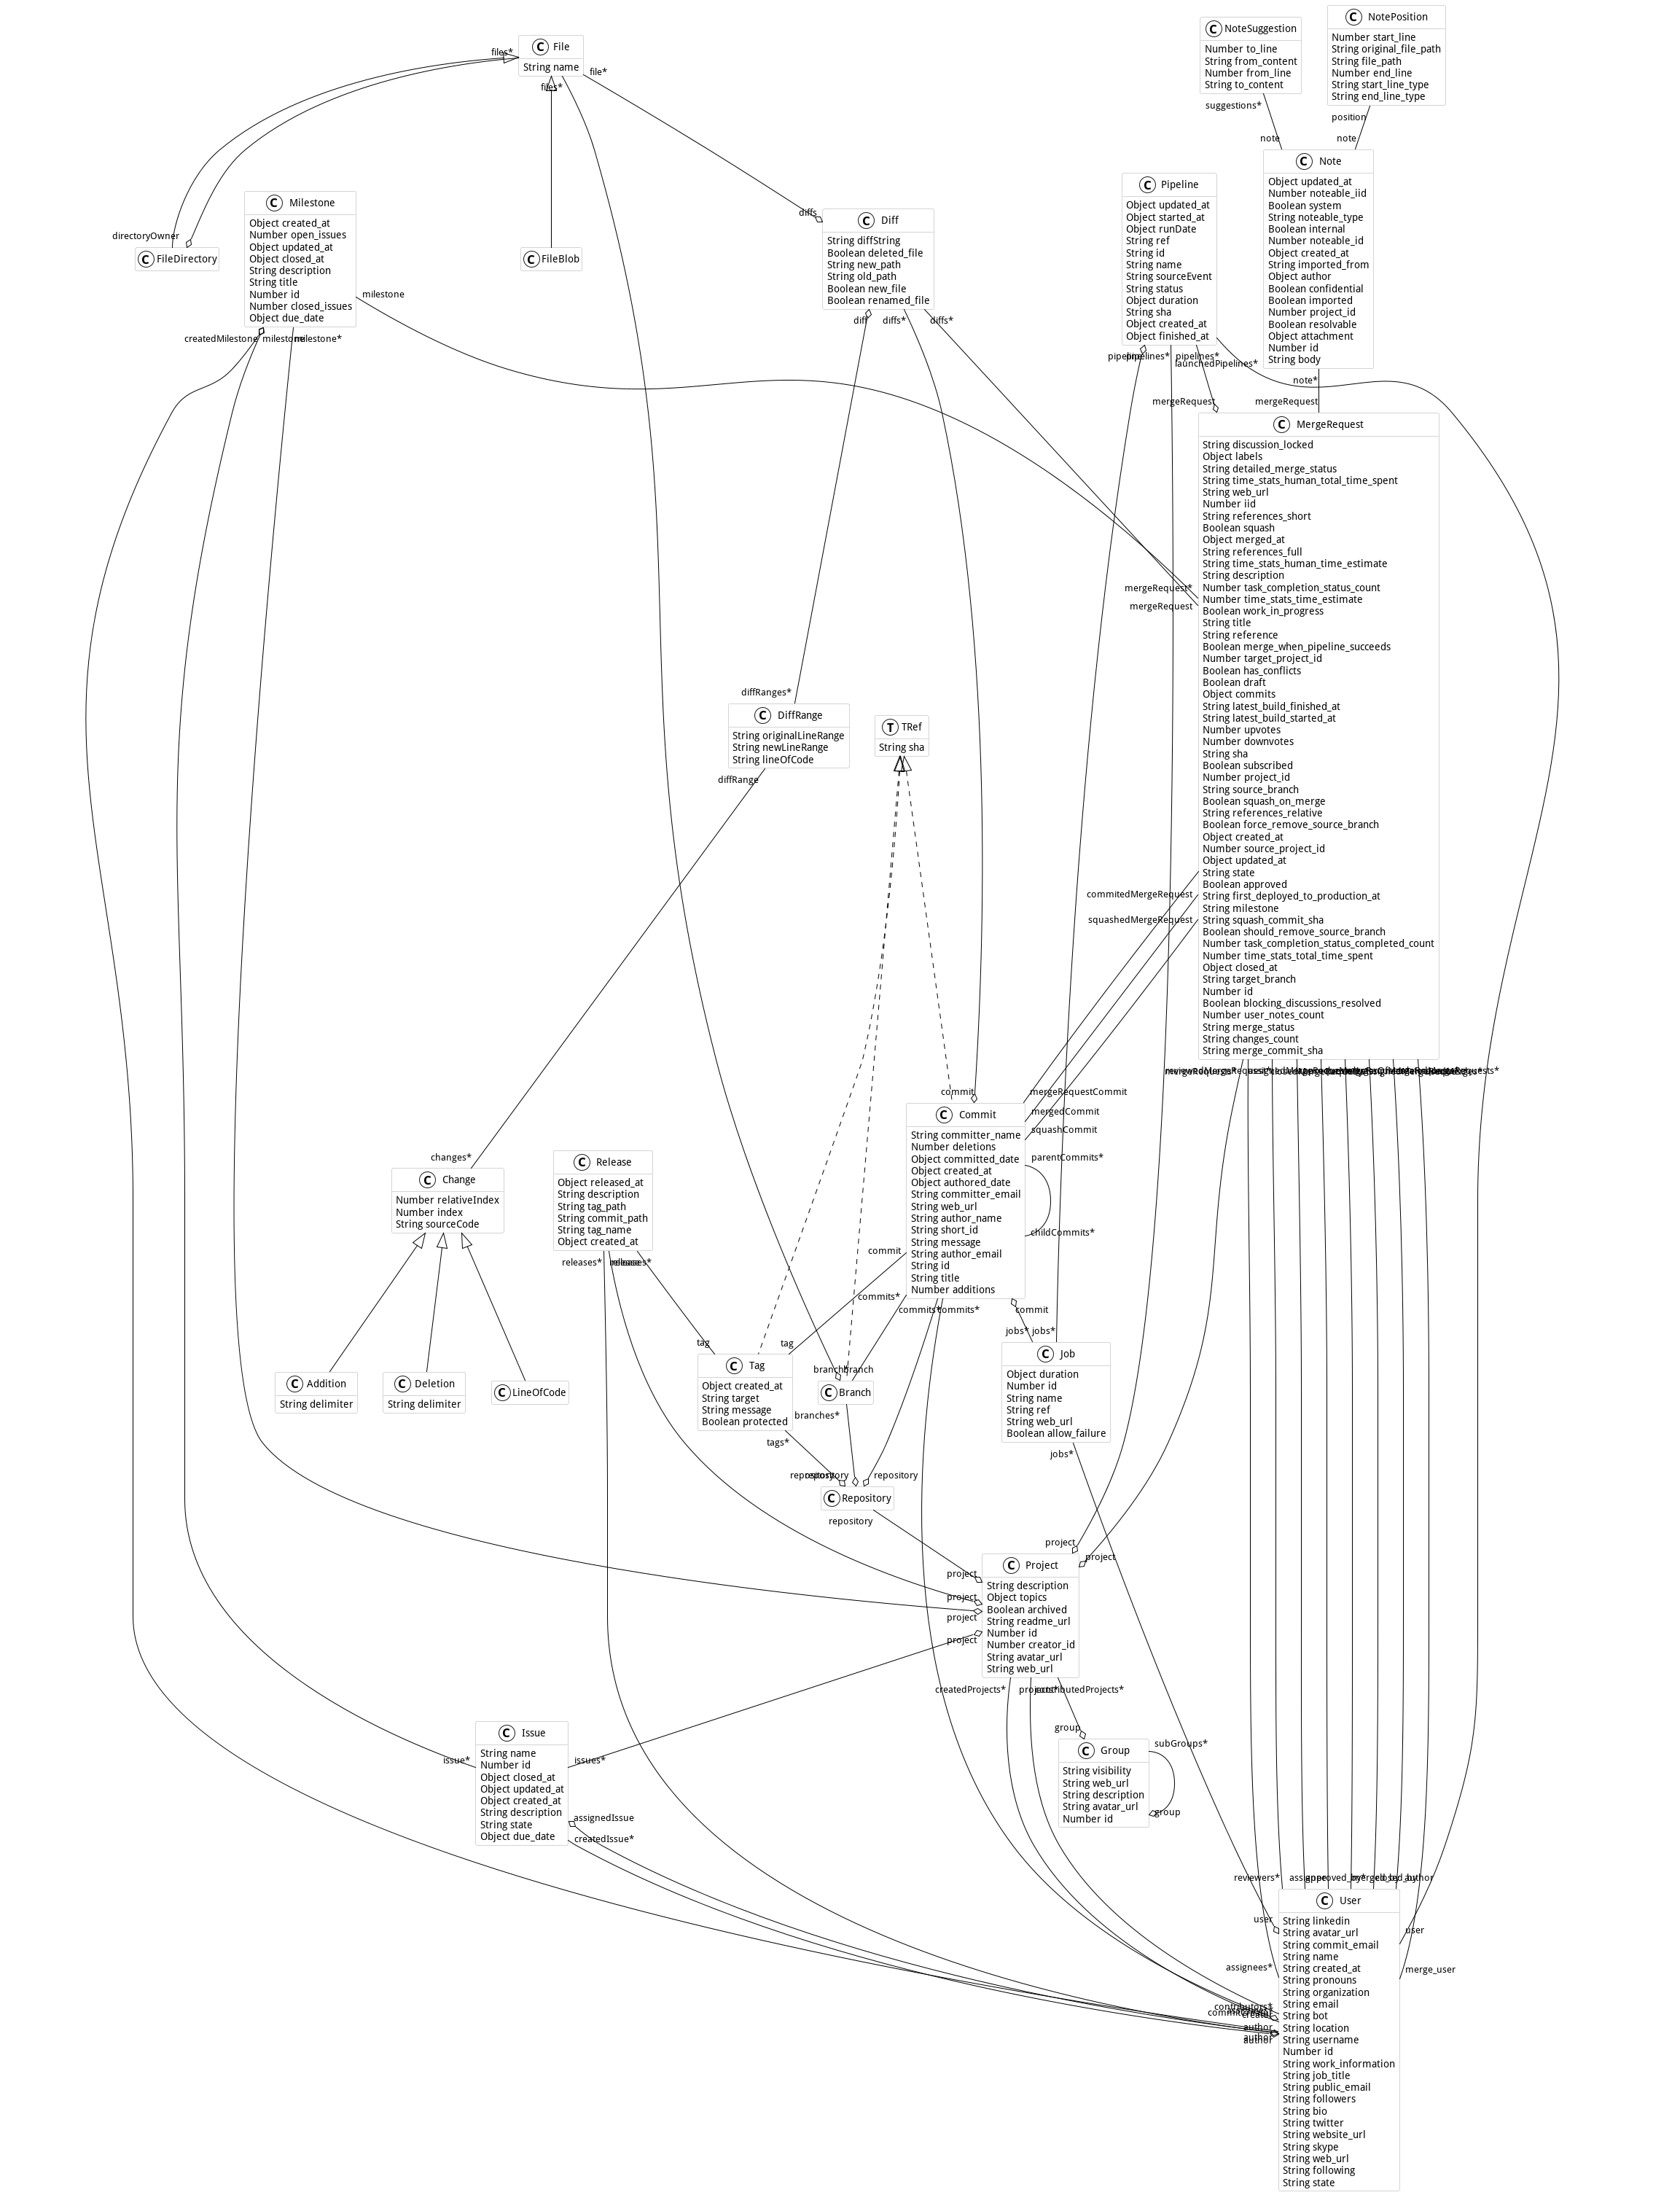
export.Here is the metamodel used in this project:
This project comes with connectors to other metamodels to increase its powerfulness. Explore this part of the documentation on the main website.
This work was first developed by the research department of Berger-Levrault.
This example shows how to set up and run GitProjectHealth metrics for a given set of users and their projects over two periods of time.
It ouputs a csv files containing: code churn, commit frequencies, code additions and deletions, comments added (e.g., //, #, /**/), average delay before first churn, and merge request duration.
| glhModel gitlabApi glhImporter |

"load GitProjectHealth into your image"
Metacello new
    repository: 'github://moosetechnology/GitProjectHealth:main/src';
    baseline: 'GitLabHealth';
    onConflict: [ :ex | ex useIncoming ];
    onUpgrade: [ :ex | ex useIncoming ];
    onDowngrade: [ :ex | ex useLoaded ];
    ignoreImage;
    load.

"set up a log at your root"
TinyLogger default addFileLoggerNamed: 'pharo-code-churn.log'.

"new model instance"
glhModel := GLHModel new.

"new API class instance"
gitlabApi := GitlabApi new
    privateToken: '<YOUR_TOKEN_KEY>';
    hostUrl: 'https://gitlab.com/api/v4'.

"new importer instance"
glhImporter := GitlabModelImporter new
    repoApi: gitlabApi;
    glhModel: glhModel;
    withFiles: false;
    withCommitDiffs: true.

"export metrics, the output files are located at `FileLocator home / *.csv`"
GitMetricExporter new
    glhImporter: glhImporter;
    addAPeriodFrom: '1 march 2023' to: '24 may 2023';
    addAPeriodFrom: '1 march 2024' to: '24 may 2024';
    setupAnalysisForUsersWithNames: { 'John Doe' };
    setupAnalysisForProjectsWithIds: { 14. 543. 2455 };
    label: 'GitLabHealth';
exportInCSV.git clone https://github.com/moosetechnology/GitProjectHealth.git
cd GitProjectHealth
sudo docker build -t code-churn-pharo .
sudo docker run code-churn-pharo &Locate and retrieve csv output files:
sudo docker ps
sudo docker exec -it <container-id> find / -type f -name '*.csv' 2>/dev/null